
· From table to story

How Chartapir turns a spreadsheet into a chart video.

Give Chartapir a clean table. It checks the numbers, finds a story the data can support, and returns a narrated MP4 with animated charts, subtitles, and music.

Spreadsheet

Checked finding

Evidence before animation.calculation ✓

One MP4

Chart + voice + subtitles + music

Bring a table.

Start with a CSV or Excel spreadsheet. If the table is trapped in a PNG or JPEG, Chartapir can read the image into a spreadsheet and show you the extracted cells for confirmation before generation begins.

No file ready? The upload screen includes a 12-month sample with Month, Revenue, and Active Customers. It uses credits like any other video, but removes the work of preparing a first file.

CSVExcelPNG tableJPEG table

Chartapir reads and checks it.

Before any story is written, Chartapir checks whether the table has a usable shape: headers, a category or date, numeric values, and enough rows to support a comparison or trend. A table that cannot support a claim stops before it becomes a confident-looking video.

01 headers02 dimensions03 numbers04 enough rows

A defensible story takes shape.

Chartapir identifies findings, matches them to supported chart scenes, and writes the narration that connects them. You do not need to choose a chart type for every column. The job is to explain what the table supports, not to decorate every number it contains.

One story becomes one MP4.

The finished video combines animated chart scenes, spoken narration, burned-in subtitles, and music. Each part has one job: charts carry the evidence, narration sets the thread, subtitles keep the story readable, and music stays underneath it.
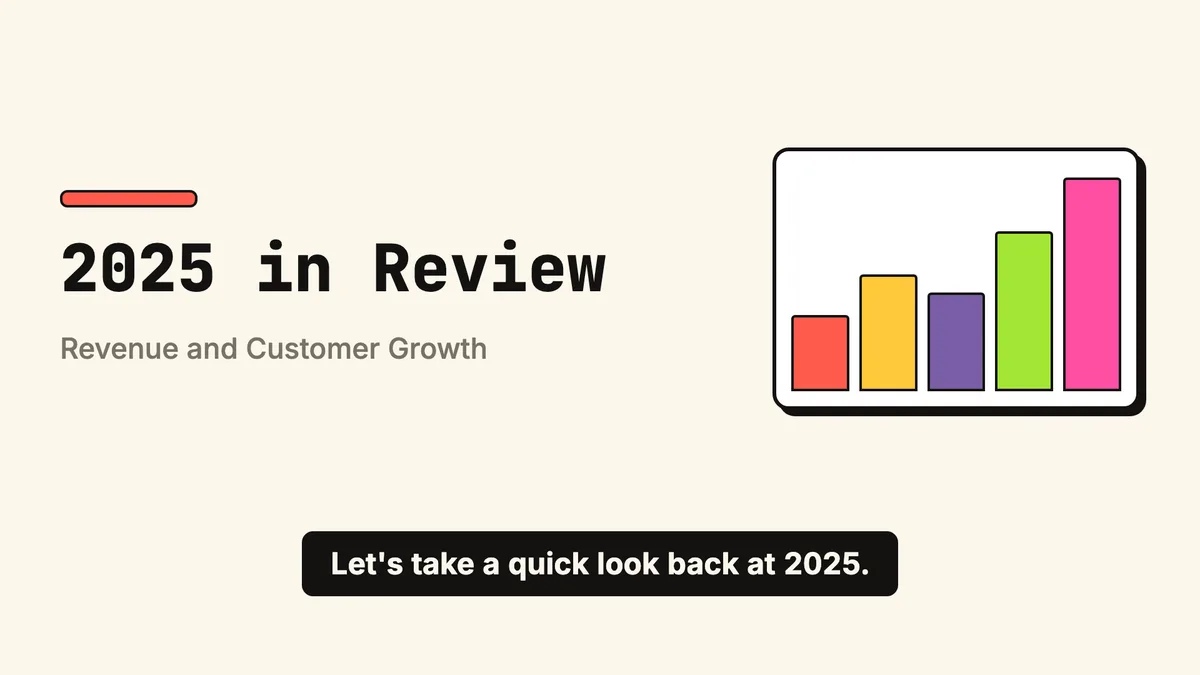
A Chartapir title scene with burned-in subtitles
Frame 54 · title + subtitles
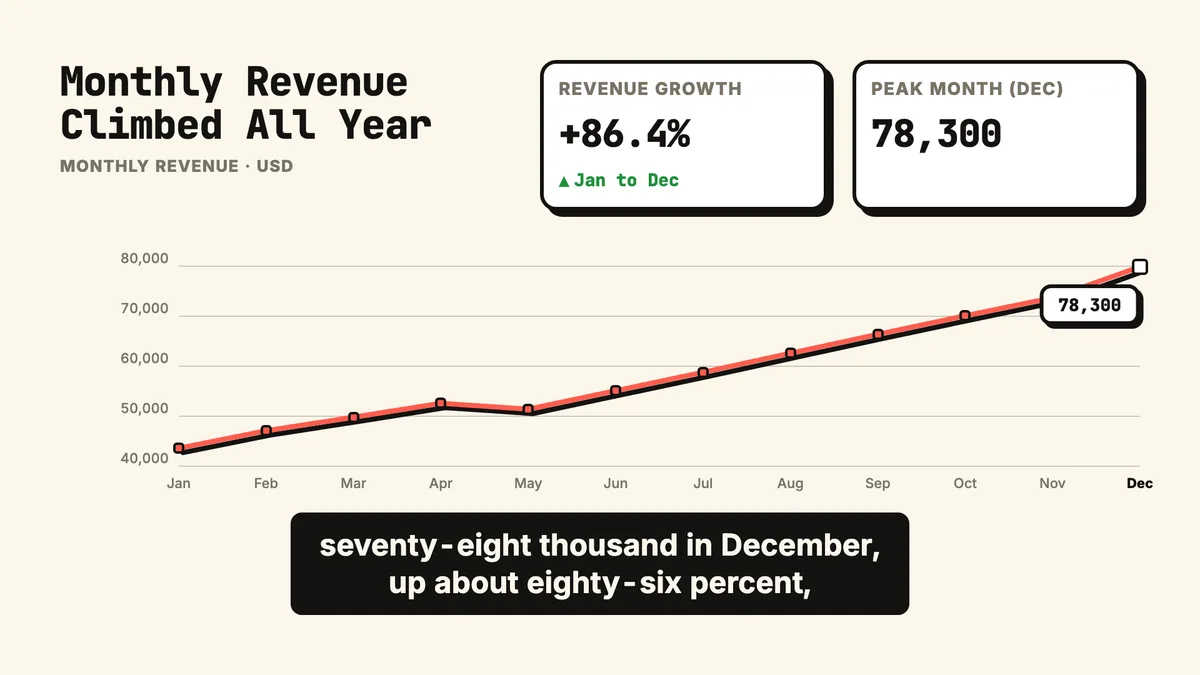
A Chartapir line chart scene showing monthly revenue
Frame 828 · evidence in motion

Both frames came from Chartapir's renderer, untouched.

Use the cut that fits.

Export the story in 16:9 for a presentation or 9:16 for a vertical feed. The numbers, narration, and music stay together while the composition is redrawn for the new frame.

16:9Deck-ready
9:16Feed-ready

Before upload

Three checks before you upload.

Clean input gives the analysis a clean starting point.

  1. 1

    Start with one header row.

    Include a category or date column, at least one numeric column, and at least two data rows.

  2. 2

    Keep numbers as numbers.

    A measurable value should be stored as a number, not buried inside a sentence.

  3. 3

    Use one clean data table.

    Remove titles, notes, merged cells, blank rows, and totals. Let the analysis work from the underlying rows.

12-month samplechart-ready
A preview of Chartapir's built-in monthly sample
MonthRevenueActive customers
2025-0142,000.00210
2025-0245,500.00228
2025-0348,200.00241

One header row. Dates down one column. Measures stay numeric.

The boundary

Accuracy is a boundary, not a slogan.

Chartapir will

  • check story claims against deterministic analysis;
  • keep currency, units, signs, and periods attached to values;
  • stop when the table cannot support the requested story.

Chartapir will not

  • invent a value because it would make a better headline;
  • add monthly stock values as though they were a flow;
  • silently treat an unreadable table as truth.

Your first run

Use the sample. Watch the whole workflow.

Start free, open the New video screen, and choose the built-in sample—or bring your own spreadsheet.

Start free